I think that “number of brilliant-but-insane former graduate students who still live in the campus library” is one of the metrics that U.S. News & World Report uses when ranking physics departments.
plotting
To visualise the R-trees created by the library, one can use the rtree-eps program which creates PostScript plots. Typically one would convert these files to PDF for inclusion in documents or (as here) to a raster format like PNG using ImageMagick or similar software.
The rtree-eps program allows one to style the resulting plot, adjusting the colour of the rectangle fill and the width and colour of lines, using a custom style file. It is easy enough to create your own files (they are just JSON), but several are included in the distribution and previews of these are shown below.
two-level styles
An R-tree with two levels will typically have fewer than a hundred
rectangles, barely worth the effort of using the library, but such
are useful for testing and development. The jjg2 style
is used on the project homepage.
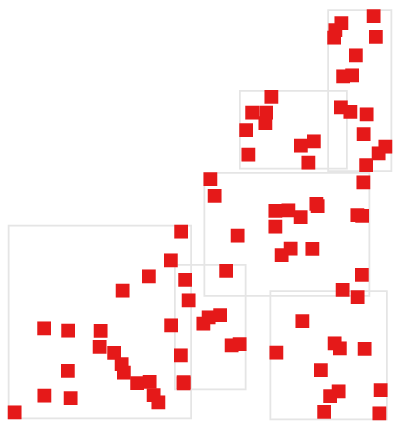
jjg2
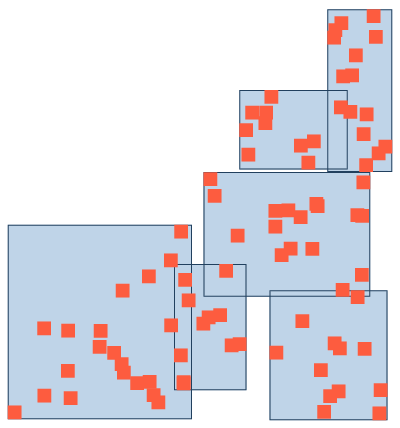
sky2
three-level styles
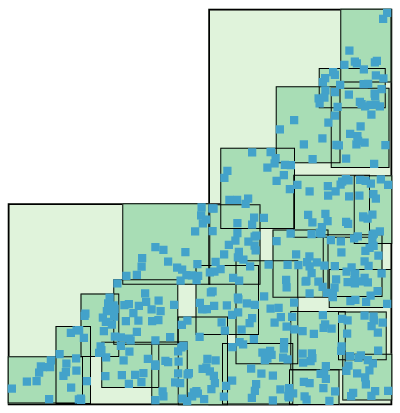
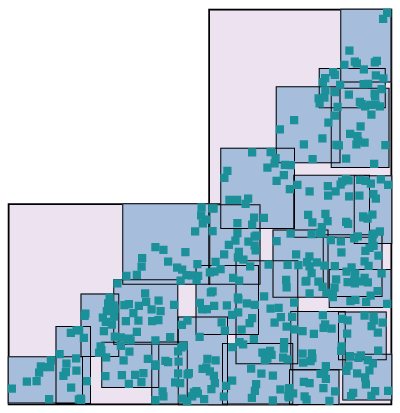
The three-level styles are for small but realistic R-trees with up to
a few thousand rectangles. For the most part these use the sequential
colour-schemas by Cynthia Brewer (hence prefixed cb-).
For further details, see the
ColorBrewer2 site or
Brewer's page on
cpt-city.
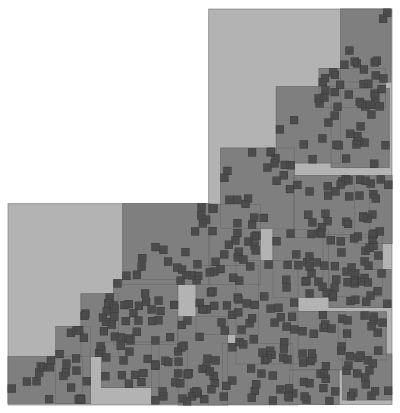
mono3
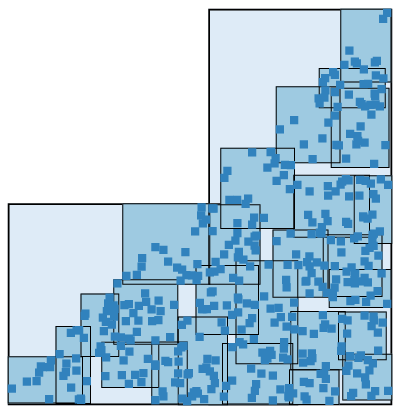
cb-blues3
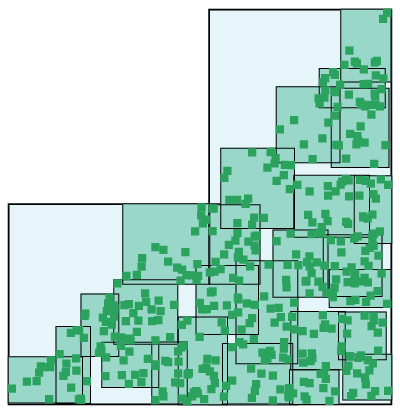
cb-bugn3
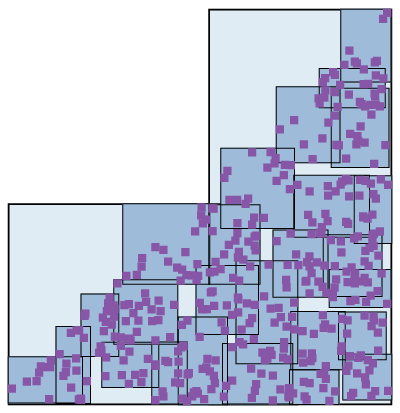
cb-bupu3
cb-gnbu3
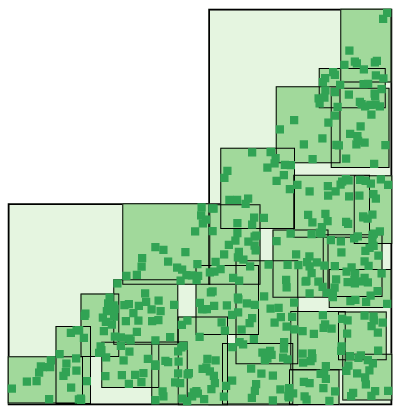
cb-greens3
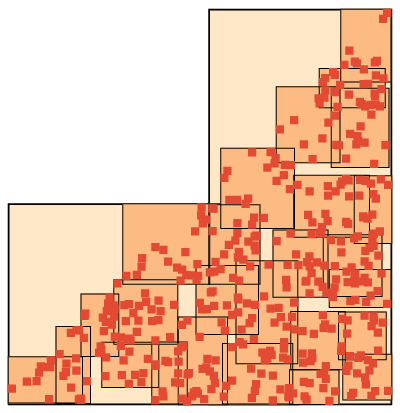
cb-orrd3
cb-pubugn3
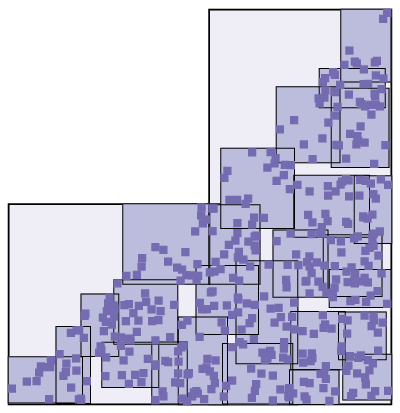
cb-purples3